10-1 vue3中使用echarts时,tooltip的trigger设置为axis时formatter不触发
js
tooltip: {
  trigger: "axis",
  formatter: function (params) {
    console.log("params", params);
  },
  axisPointer: {
    type: "shadow", // 阴影指示器
  },
},tooltip: {
trigger: "axis",
formatter: function (params) {
console.log("params", params);
},
axisPointer: {
type: "shadow", // 阴影指示器
},
},解决办法: 用 markRaw 让echarts从监听对象变成普通对象!!!
js
import { ref, reactive, watch, onMounted, markRaw } from 'vue';
...
const chartBox = document.getElementById('chart-box');
myChart = markRaw(echarts.init(chartBox));
import { ref, reactive, watch, onMounted, markRaw } from 'vue';
...
const chartBox = document.getElementById('chart-box');
myChart = markRaw(echarts.init(chartBox));10-2 echart x轴标签文字过多显示被重叠的解决办法
解决办法 1、不显示全部标签, 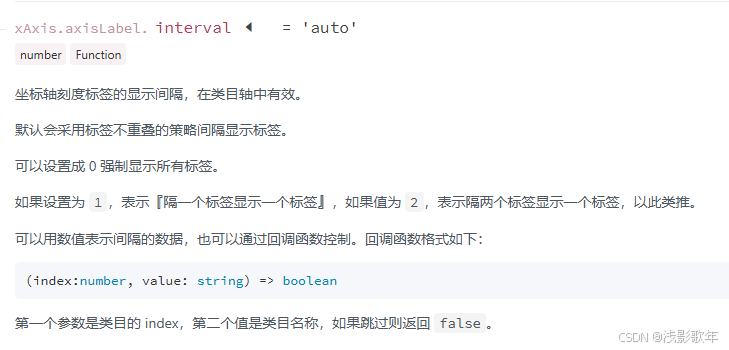
javascript
xAxis: {
      type: 'category',
      data: xAxisData,
      axisLabel: {
        color: 'rgba(255,255,255,0.65)',
        fontSize: 10,
        interval: 'auto',
        rotate: 15,
      },
},xAxis: {
type: 'category',
data: xAxisData,
axisLabel: {
color: 'rgba(255,255,255,0.65)',
fontSize: 10,
interval: 'auto',
rotate: 15,
},
},2、倾斜标签 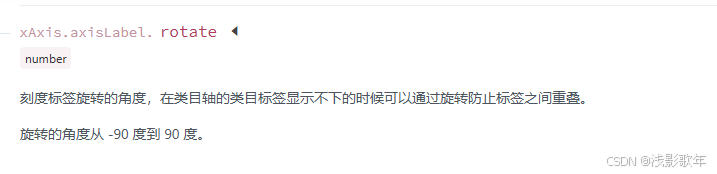
javascript
xAxis: {
      type: 'category',
      data: xAxisData,
      axisLabel: {
        color: 'rgba(255,255,255,0.65)',
        fontSize: 10,
        rotate: 15,
      },
},xAxis: {
type: 'category',
data: xAxisData,
axisLabel: {
color: 'rgba(255,255,255,0.65)',
fontSize: 10,
rotate: 15,
},
},3、 标签行换
javascript
xAxis: {
      type: 'category',
      data: xAxisData,
      axisLabel: {
        color: 'rgba(255,255,255,0.65)',
        fontSize: 10,
        formatter(value) {
          // 每8字符换行
          const str = value.replace(/(.{8})/g, '$1\n');
          return `{a|${str}}`;
        },
        // 文本样式控制行间距
        rich: {
          a: { // 定义名为 'a' 的样式块
            lineHeight: 16 // 行高设为20像素
          }
        }
      },
},xAxis: {
type: 'category',
data: xAxisData,
axisLabel: {
color: 'rgba(255,255,255,0.65)',
fontSize: 10,
formatter(value) {
// 每8字符换行
const str = value.replace(/(.{8})/g, '$1\n');
return `{a|${str}}`;
},
// 文本样式控制行间距
rich: {
a: { // 定义名为 'a' 的样式块
lineHeight: 16 // 行高设为20像素
}
}
},
},